

Inflation: Establishing Asset Class Base Rates
This excerpt is lifted from Epsilon's 2Q22 investor letter, released July 7th. This will be the first of a series of posts reviewing the academic literature on asset class behaviors during inflationary conditions.
Given how poorly equity markets have performed to start the year[1] and the broad recalibration investors are engaging in, it may be useful to establish a base rate of asset class performance during different inflationary regimes. The best literature[2] we have read on this comes from Nikolai Roussanov, Yang Liu, and Xiang Fang, a set of researchers from Wharton. Their 2022 paper, Getting to the Core: Inflation Risks Within and Across Asset Classes sheds light on these questions through an exhaustive approach. They unpack not only the impact of headline inflation on asset prices but also drill into different forms of inflation (specifically core, food, and energy). Their period of analysis is from 1963 to the end of 2019.
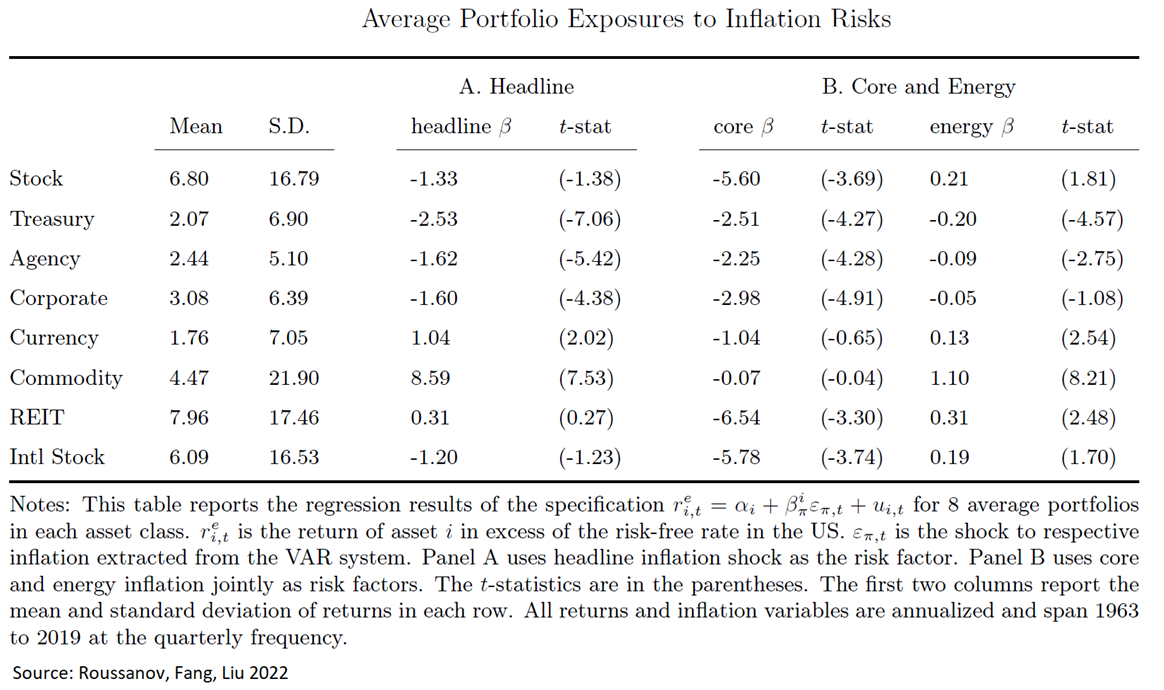

Starting with headline inflation (the columns “A” in the table above), the research unsurprisingly suggests fixed income (split across treasury, agency, and corporate) has the most pronounced negative exposure to an inflation shock. The impact on stocks, both domestic and international –while negative – is statistically insignificant. The strongest positive exposure is commodities, followed by currencies. REITs are negligible.
This equation changes quite a bit when inflation risk is decomposed into core and energy (columns “B”) inflation. With core inflation, no asset is spared. Commodities and fx[3] are perhaps the least scathed, but the damage to risk assets is palpable. Energy inflation also represents its own dynamic. It acts with shades of both core and headline; stocks[4], REITs, and commodities are the most positively impacted, while fixed income is the most adversely impacted.
Of course, the sample period is heavily influenced by the inflationary shock of the 1970s. To provide a control for this, the authors disaggregate the analysis into pre and post 1999, finding differing impacts of headline inflation on stocks. In the earlier period (1963 – 1999), headline inflation has a far more negative impact on stock values. They also split apart ‘sticky’ versus ‘flexible inflation’, demonstrating the far more onerous impact from sticky inflation on all asset classes.
To provide more tangible returns data on the area of import (core inflation), we can look at asset price performance in different core inflation regimes. We see that many asset class returns are impaired during high core inflation. This chart does a good job decomposing it:
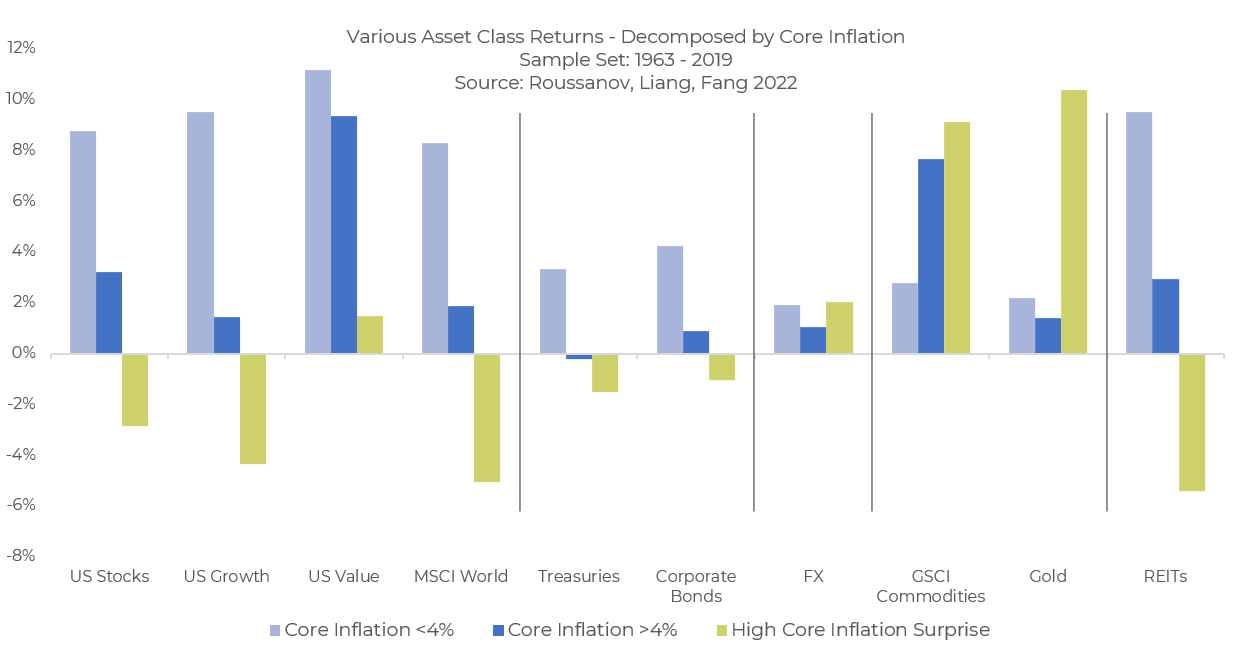

The data suggests that commodity-adjacent exposures seem like a worthwhile hedge during periods of elevated core inflation. Curiously, gold, often viewed as a safe haven from inflation, is less empirically impressive. Where gold does shine is what the researchers call periods of inflation surprise. This may reflect the reflexive nature of markets: participants expect a flight to gold, even as the data suggests a poor base rate performance of the precious metal across sustained core inflation. US Value stocks also appear to provide meaningful protection[5]. A deeper analysis should involve starting points of valuations heading into differing regimes, as well as anticipatory controls; equity market participants begin rotations before headline figures come to reality.
As (primarily) domestic equity investors, what does this leave us with? First and foremost, a serious concern toward sticky core inflation. With the fed dealing markets a dose of medicine, it seems altogether reasonable to welcome incremental rate hikes if it halts inflation from permeating into individual expectations, which arguably become much harder to tame. Second, the current path dependency of asset prices was greatly impacted by the commodities shock caused by the Russian invasion of Ukraine. In short, think about the path not only the long-term average. Third, a recognition that growth exposure was the wrong foot forward heading into a ‘surprise’ inflationary shock. Markets have a way of intoxicating participants into the most perilous exposures.
---
The information contained in this article was obtained from various sources that Epsilon Asset Management, LLC (“Epsilon”) believes to be reliable, but Epsilon does not guarantee its accuracy or completeness. The information and opinions contained on this site are subject to change without notice.
Neither the information nor any opinion contained on this site constitutes an offer, or a solicitation of an offer, to buy or sell any securities or other financial instruments, including any securities mentioned in any report available on this site.
The information contained on this site has been prepared and circulated for general information only and is not intended to and does not provide a recommendation with respect to any security. The information on this site does not take into account the financial position or particular needs or investment objectives of any individual or entity. Investors must make their own determinations of the appropriateness of an investment strategy and an investment in any particular securities based upon the legal, tax and accounting considerations applicable to such investors and their own investment objectives. Investors are cautioned that statements regarding future prospects may not be realized and that past performance is not necessarily indicative of future performance.
[1] The worst 1st half total return for the S&P 500 since 1970.
[2] There is an entire scholarship on inflation research and its impact on asset prices, including seminal works by Fama and Schwert (1977), Fama (1981) and more recently Katz, Lustig, and Nielsen (2017).
[3] Fx asset class represents a standard dollar carry strategy.
[4] It is important to know how representative equity indices were from prior periods of energy inflation in relationship to their current composition. To this, a simple comparison of GICS sector weights is instructive.
[5] This coincides with arguably the ‘golden’ period of value factor performance, before it was systematically exploited beginning with publications in the 1980s. To expect that magnitude of risk premia to persist given the sheer amount of capital devoted towards its capture may be asking a bit much.