

Inflation: The Money Illusion
This will be the second in a series of posts reviewing the academic literature on asset class behaviors during inflationary conditions. You can read the first here.
many try to outwit their fellow investors in order to maximize their own proportions of corporate earnings. This thrashing about, obviously fruitless in aggregate, has no impact on the equity coupon – Warren Buffett
In the first post of our inflation series, we unpacked asset class performance under various inflationary regimes: low vs high, anticipated vs unanticipated, core & energy vs headline to name a few. The broader takeaways were that core inflation has been a killer of asset class performance and inflation surprises have been very difficult for long duration assets. These conclusions were based upon research that analyzed data from 1963 – 2019, so our present situation represents an out of sample - and largely confirmatory - period.
As equity investors, we drill into the behavior of stocks with greater focus. The perception of inflation’s impact on stocks is more mixed than, say commodities (beneficial) or bonds (deleterious). It has also varied over time. Prior to the 1970s, equities were perceived as a good inflation hedge. That belief was severely tested in the 1970s. Challenging equity market performance led to many assumptions being questioned. Setting the table for why the debate over equities and inflation became topical in the late 70s, let’s review broad return data for the period following the inflationary spark of 1973:
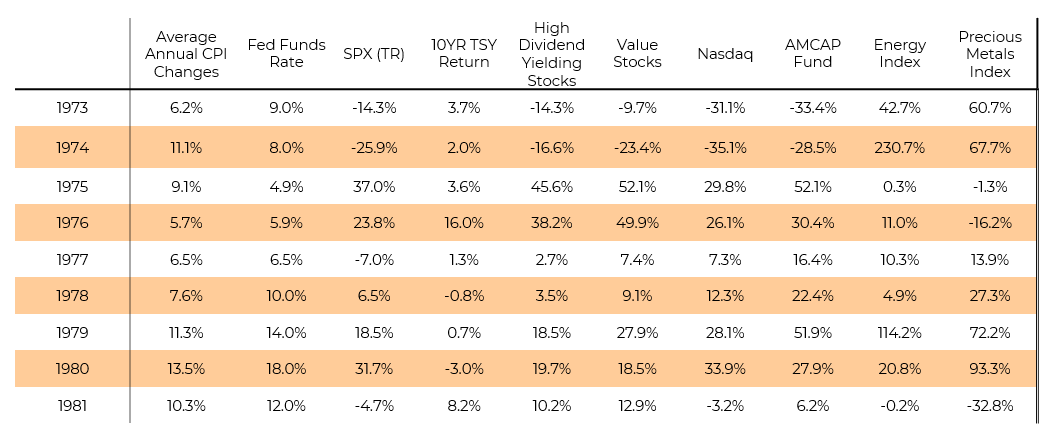

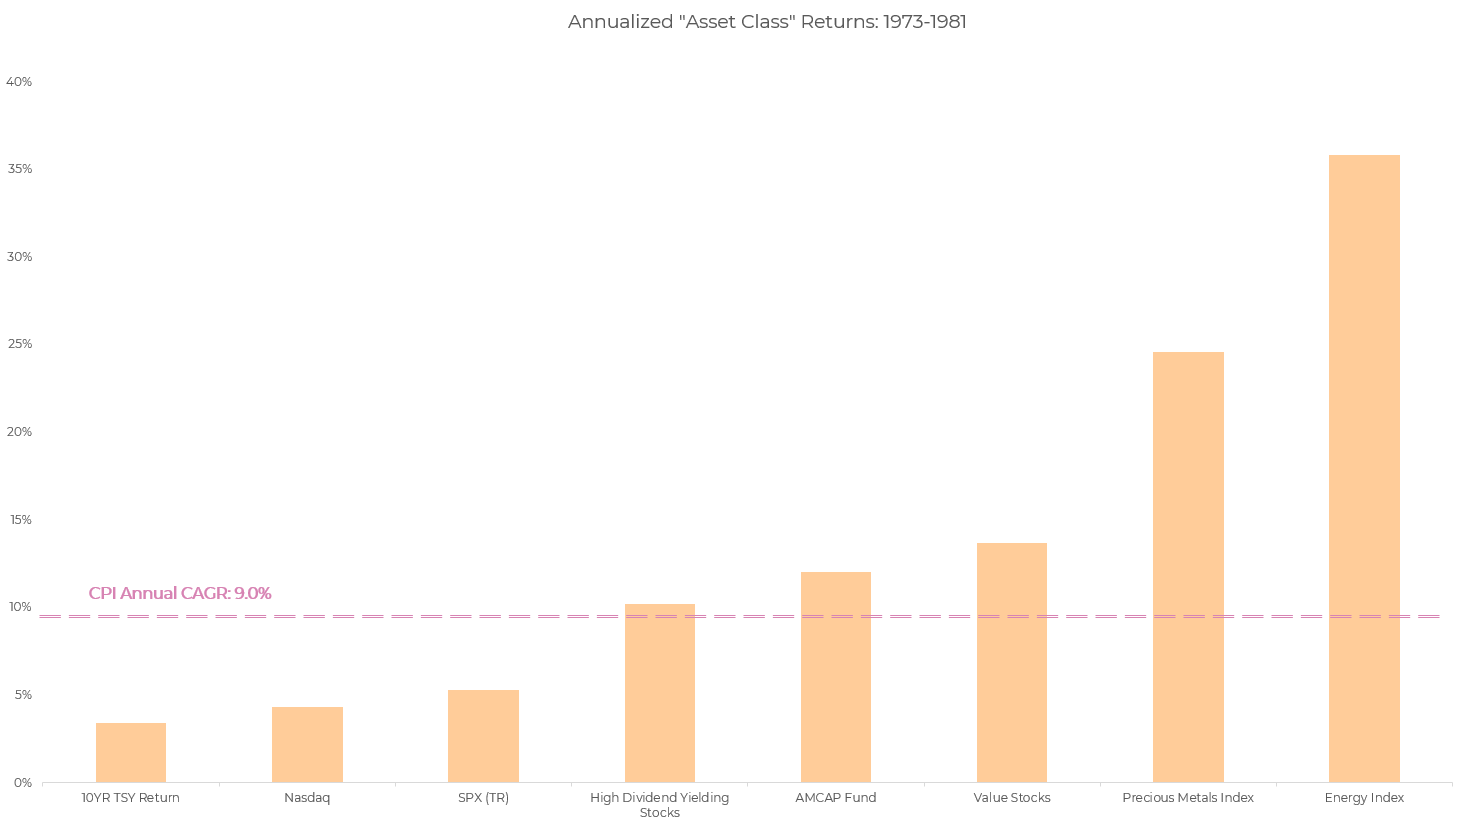

The 5.3% CAGR of the S&P 500 TR badly lagged the 9% annualized growth of CPI. High dividend stocks and value stocks did comparatively better. But a logical question to ask is what went wrong for US stocks, broadly? Why weren’t they the inflation hedge they were assumed to be? In 1979, two esteemed researchers sought to find out.
Money Illusion – A Shot at the Efficient Market Hypothesis (EMH)
In their paper, Inflation, Rational Valuation and the Market, Franco Modigliani[1] and Richard Cohn present a thesis for why US equities underperformed broader inflation and thus lost purchasing power. Their conclusion? A Money Illusion[2]. Money Illusion can broadly be thought of as investor errors in assessing asset prices. It is indeed bold to chalk up a decade plus of asset class performance as the compounded error of equity investors. The authors admit to as much. This caused quite a bit of pushback, specifically from the EMH camp. In 1981, Gene Fama – the father of EMH – published a famous paper providing a different interpretation (perhaps we will tackle this in a latter piece). We find Modigliani and Cohn’s analysis well articulated. Let’s unpack.
Money Illusions and Valuation Frameworks
Their entire thesis rests upon the base foundations of valuation frameworks; specifically, how investors capitalize earnings and how they depreciate liabilities. When looking at any discounted cashflow model, these are key components in deriving equity value. The authors suggest that investors utilize nominal rather than real rates in performing a discounting of cash flows, which depresses their measurement of profits and thus value. Similarly, on the debt side of the equation, investors fail to depreciate liabilities appropriately, conflating nominal with real rates, impacting “accounting” vs real profitability. Their model suggests (and the data backs up) if investors control for real rates, true corporate profitability did not decline in this period where inflation was elevated. Therefore, the lag in equity returns is unrelated to a deterioration of earnings or corporate profitability caused by inflation.
After walking through the usual rational expectations model one would expect in an academic paper, this piece unusually becomes a dialogue between the authors and the reader, wherein they questioned their initial assumptions but gained confidence in their hypothesis after years of observation. To provide anecdata, they monitor sell side analysis which perpetuates their purported mistake. It is a rare and interesting for academic researcah to suggest analytical problems by market participants aren't neatly arbitraged by an efficient market.
Noisy Little Details
There is of course nuance to the model. Of note, the treatment of tax on interest payments as well as the nature of the capital structure of a company. This can create variance at the company level of analysis. But their broader point is addressing aggregate corporate profitability and thus aggregate stock market behavior. Their model goes through several layers of explaining why en aggregate, expected inflation should not impact long-term valuation of the company’s cashflows.
There are a few additional things to unpack: inflationary surprise (an important part of ‘real rate’ equation) and valuation multiples (the output of earnings and measured price). Beginning with the former, the model relies upon an assumption that inflation rates are anticipated by the market and thus reflected in cost of capital. Further researchers expand upon this concept through a framework called “The Fed Model”, wherein the opportunity cost of earnings yield is measured in relation to that of Treasury yield.
Then there is a bit of ‘tail wagging the dog’ with real rates. Its transmission, vis a vis the bond market, is a testy subject given the influence of “non-economic” actors. Notable ones over the years include the savings glut, QE, bank capital requirements, et al…Finally, there is the issue of unanticipated inflationary shocks and its impact on asset classes. We touched upon that in the prior piece. During the author’s period of analysis, historians often cite the Yom Kippur Wars (1973) as well as the Arab Oil Embargo (1973-74) as two such unanticipated inflationary shocks. In our current period, many are citing the Russian invasion of Ukraine as another (2022).
Behavioral Characteristics and Multiples
Valuation multiples are a topic often skirted by rational expectations literature. Its trajectory falls outside of the modeling of homo economicus. Fancy statistical models like GARCH and Hidden Markovs will not tell you with certainty how the market will ultimately choose to stretch or squeeze multiples. At best, we look at cyclically-adjusted historical data (e.g., Shiller), factor in corporate profitability (more on that later), and attempt to measure deviation from norm with an underpinning of mean reversion. We step away from the thorny issues of political economy when assessing time-series. These vicissitudes are often tackled by behavioral finance[3], a field that was barely nascent at the time of the author’s publication.
But as all things, starting points matter. It should not be forgotten that the era of the NIFTY 50 (late 1960s) and our most recent s-curve & disruption obsession (2015-2021) coincided with breathtaking valuation multiples. Most recently, the valuations seen by software companies fail to even comport with the author’s model, which is predicated upon discounting cash flows. Many of these companies today have no such cash flow. We tackled this topic somewhat briefly in a piece last year about Boom Firms.
But if we accept the broader conclusions of Money Illusion, we conclude that the ‘accordion’ of valuation during periods of persistent inflation is arguably too compressed. This trend in the 1970s led to a change in political economy during the 1980s (as neoliberal Reaganism and Thatcherism spread), and an investing milieu where corporate raiders sought to unlock compressed value through financial innovation[4].
It's All in the ROE
It may be unreasonable to expect a replay of the same trend. Markets are adaptive and nonstationary. Conditions and the composition of equity indices have changed. But it is telling that the authors demonstrated that there was no trend change in discernible corporate profitability during the woeful 1970s, wherein stock valuations badly compressed and returns suffered. To do so, they leveraged NIA corporate profits after tax with interest as their preferred measurement (as seen in line #3 below), which is roughly equivalent to return on equity. This ties into their model’s emphasis on capitalization and depreciation errors. Note how line #1 trends down, which may lead one to believe in the deterioration of profitability, whereas line #3 does not:
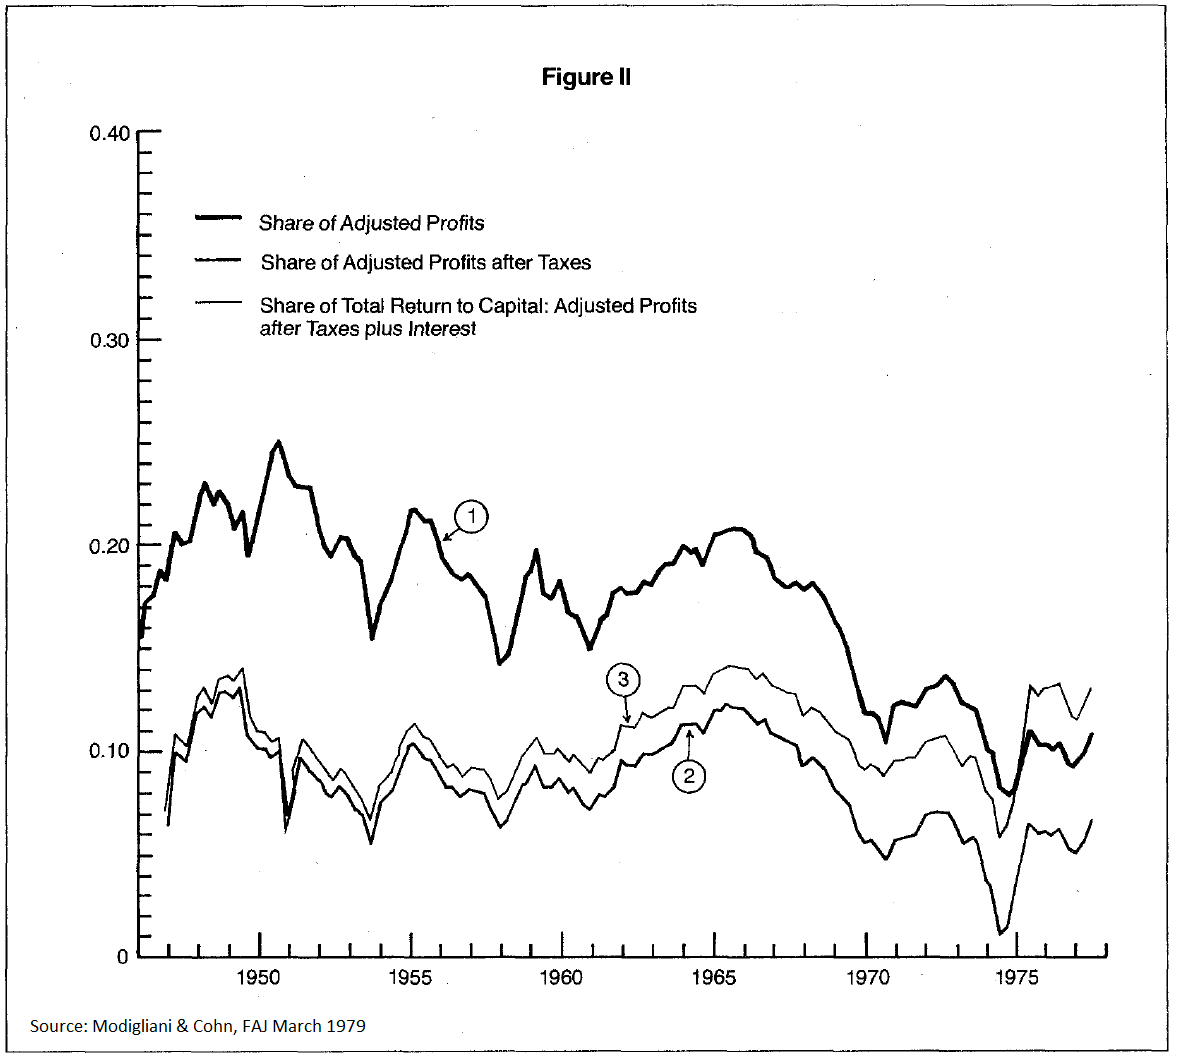

As present day investors, we should be cognizant that tax law has changed several times with regard to interest treatment[5], an integral part of their analysis. Most notably, in 1989 (Regan reforms) and then in 2017 (TCJA). This makes an apples-to-apples comparison of NIA/NIPA profits post tax/interest a bit more challenging.
For much of the 1970s as equity markets underperformance, ROEs were robust, maintaining trend. As has been the case most recently, after-tax corporate profits have been on a positive upswing since the early 2000s. Profits broadly were more challenged in the 1980s when markets coincidentally recovered. Such is the way with market dynamics, discounting probable future . In our next post, we’ll dive deeper into the concept of ROE and the ultimate price one pays for earnings yield, from a practitioner’s view.
---
The information contained in this article was obtained from various sources that Epsilon Asset Management, LLC (“Epsilon”) believes to be reliable, but Epsilon does not guarantee its accuracy or completeness. The information and opinions contained on this site are subject to change without notice.
Neither the information nor any opinion contained on this site constitutes an offer, or a solicitation of an offer, to buy or sell any securities or other financial instruments, including any securities mentioned in any report available on this site.
The information contained on this site has been prepared and circulated for general information only and is not intended to and does not provide a recommendation with respect to any security. The information on this site does not take into account the financial position or particular needs or investment objectives of any individual or entity. Investors must make their own determinations of the appropriateness of an investment strategy and an investment in any particular securities based upon the legal, tax and accounting considerations applicable to such investors and their own investment objectives. Investors are cautioned that statements regarding future prospects may not be realized and that past performance is not necessarily indicative of future performance.
[1] In 1958, he, along with Merton Miller, published groundbreaking work on the foundations of capital structure theory. He contributed to the analysis of inflation in the 1970s with the NIRU metric, a natural rate of employment that factors in inflation (topical today). Modigliani won the Nobel Prize in Economics in 1985. For more information on his biography see: https://www.nobelprize.org/prizes/economic-sciences/1985/modigliani/biographical/
[2] A glib reference to Irving Fisher’s 1928 book about the perceived nature of inflation. It also refers to Milton Friedman’s follow-on work regarding individuals’ behavior in assessing wealth in nominal vs real terms.
[3] See for example Summers 1986, “Does the Stock Market Rationally Reflect Fundamental Values?” or Hirshleifer 2002, “Investor Psychology and Asset Pricing.”
[4] Connie Bruck’s Predator’s Ball is a great (albeit arguably biased) examination of the period.
[5] For a historical perspective harkening back to 1893, see: https://www.chapman.edu/law/_files/publications/CLR-18-steven-bank.pdf