

Base Rates & Stationarity
- Assuming stationarity in long-term trends can lead to a poor application of base rates
- This plagues various “mean-reversion” market calls
- To avoid this, we must understand the principals and formulation underlying long-term metrics and find ways to unearth potential non-stationarity
A common trope amongst professional investors is that retail is dumb money and is a source of alpha. We discussed in a prior post why this convention was being overturned in a momentum “Dunning-Kruger market”. While retail is having its day, we highlighted the key differentiator of the professional investor: an ability to form base rates through accumulated experience and analysis. Through these base rates, pros can improve the quality of their priors in assessing future probabilities. This can be done at the individual company level (“how probable is it that this SPAC’s revenue guidance for 2025 is achievable?”) or at a broader index level (“how expensive is the market today?”). But how much signal can we truly extrapolate from priors? And what pitfalls should investors be concerned with in doing so?
Let’s take the case of valuation, most commonly viewed through the lens of price/earnings. Let’s simplify its application through the broader market index. A favorite chart of macro, chartist, and mean-reversionists is a long-term trend of S&P 500 valuations, perhaps with some historical standard deviation overlay. This allows one to compare the current market’s deviation from a historical mean. In doing so, we can form base cases for future events based upon similar circumstances in the past. This can be a helpful framework for assessing causality. The following chart from JP Morgan Asset Management demonstrates a regression of consensus analyst 12-month forward P/E for the S&P versus each period’s subsequent 5-year market returns:
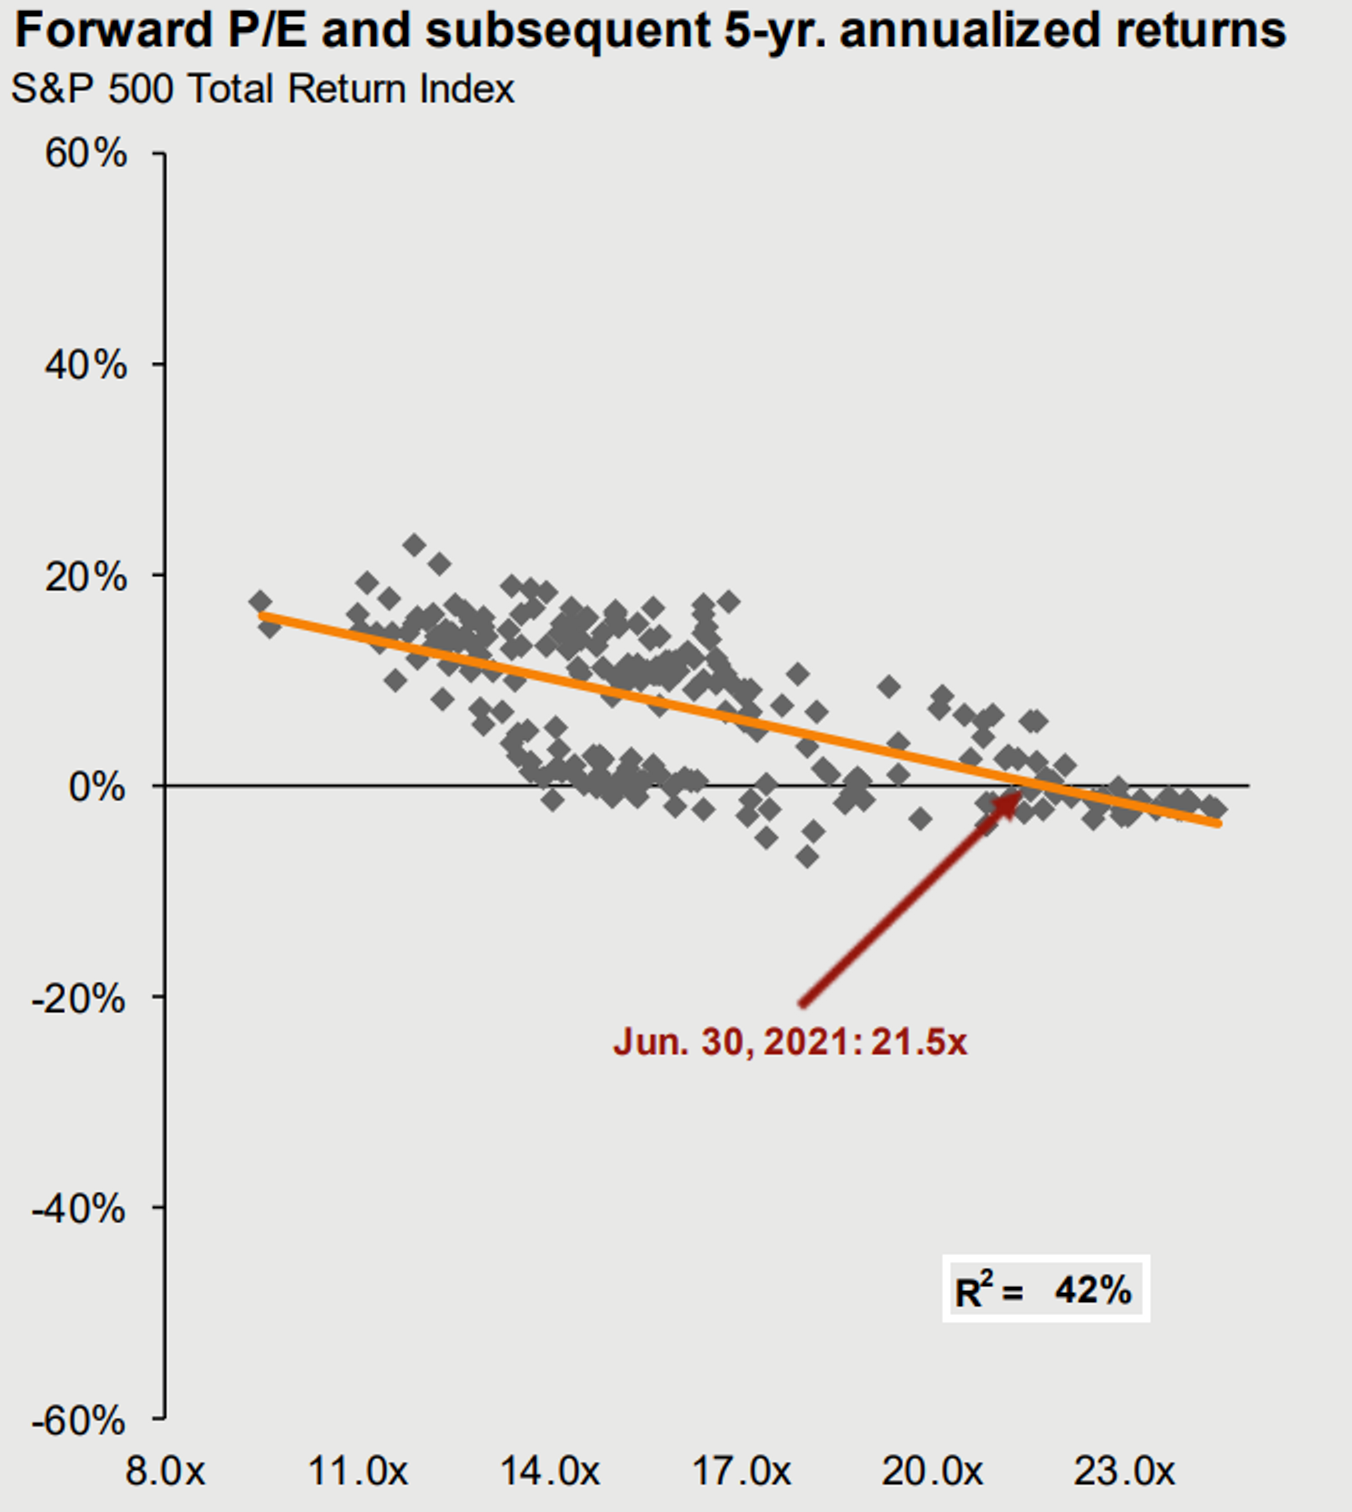

The slope, shape, and relatively strong coefficient of determination provides a clean visualization for establishing a mean-reversion argument. In this case, a prior is formed, which is to say, as the market trades expensive, (i.e., a higher forward multiple), the lower one should expect future 5-year return. This makes a lot of sense, as paying more for future cash-flows, ceteris paribus, draws return from the future. The key words in that argument are, ceteris paribus (all-else equal).
Not everything in the historical data is always equal. This is the case, even though we are using the same metric for the same index. This can be referred to as non-stationarity. Extrapolating from non-stationary trends is dangerous in informing investment decisions. For example, this simple insight regarding how ‘expensive’ the market appears to be has recently led mean reversionists to two overarching conclusions: equities are expensive, US equities even more so. The conclusion was to diversify away to cheaper assets (e.g., international or EM equities). For just about a decade now, that was absolutely the wrong trade.
How do we process this? Well first, a regression fit is not a truism, it is merely an expectation and a reasonably weak one (r^2 = .42) at that. Another view is that a comeuppance for US equities is overdue; that markets can be like a rubber band, stretching farther than what seems sensible, only to snap back violently, bringing us back to equilibrium. Another camp says that natural equilibration has been violated by egregious monetary policy, black swans, insert your gripe du jour.
In our opinion, each camp is partially right but wholly wrong. We are strong believers in the long-term weighing function of the market and seek not to quibble too much with sensible valuations. But market participants are rewarded on being right not simply being stubborn, strident, or contrarian. An honest analysis of what went wrong must start with first principles, and in this case, it starts with the underlying price to earnings metric and its comparability with the past.
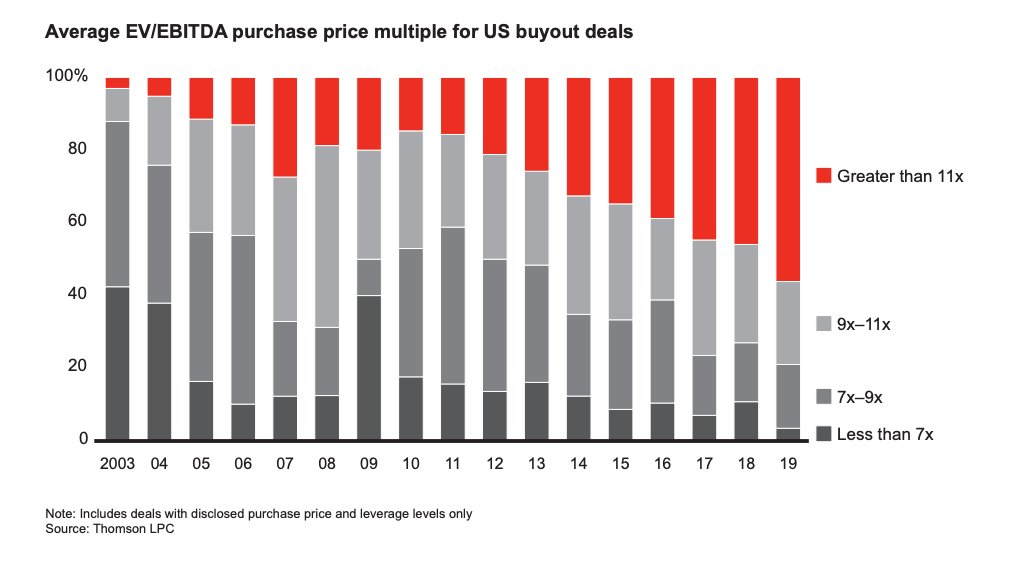
P/E is a simple heuristic for valuation and is commonly interpreted as the market’s animal spirit. Higher multiples portend bullishness while low multiples demonstrate bearishness. Because this behavioral reaction is viewed as myopic rather than analytical, one can trade around mean-reversion of broader multiples. Thinking like a business owner (“skin in the game”) is often touted as a means of avoiding those ups and downs. Private equity may in some sense embody that ethos. But even with leveraged buy-outs, the goal posts on an ‘median’ earnings multiple have moved. For example, at the beginning of this cycle, private equity buyouts averaged 7-8x EV/EBITDA (a cousin of P/E ratio), and they now sit closer to 12-13x:

Much ink has been spilt as to why valuations continue to rise: TINA (“There Is No Alternative”) is a recurrent argument and dovetails into the monetary policy intervention hypothesis. Agency bias (even with private equity) is one. Generational differences between today’s young investors and those that have been scarred by prior tumult, another.
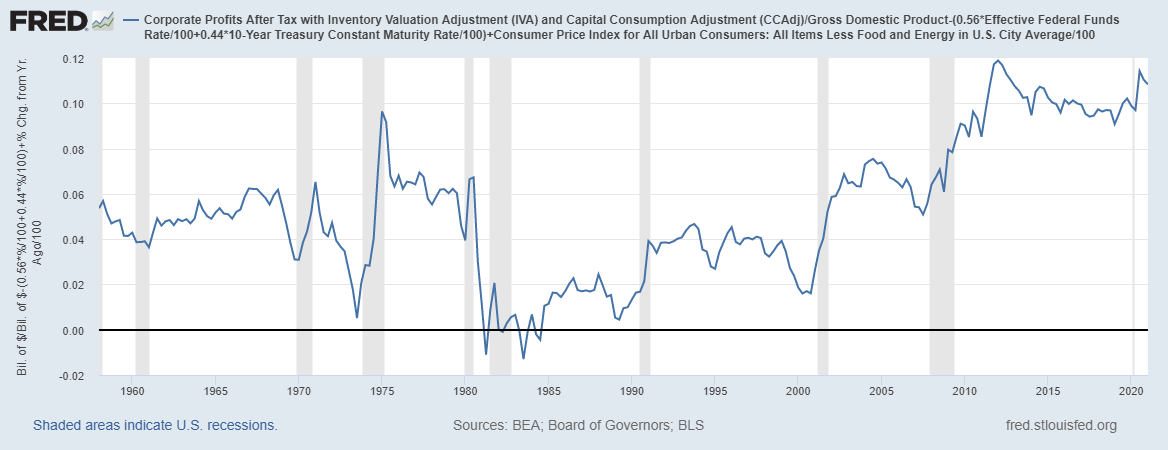
What is too often disregarded is the composition and quality of the market’s earnings which changes over time due to a variety of long-arc secular shifts. A major but somewhat unheralded change in the US economy has been the increasing profitability of corporate America. Across a variety of metrics (NIPA profits are probably our favorite), the rate has risen well beyond historical average. Here’s a 60 year time-series provided by FRED, demonstrating the elevated aggregate profit levels compared to prior periods. Most analysts quickly understand paying superior multiples for higher margin businesses and durable growth rates yet disregard the aggregate profitability of the corporate sector in making historical comparison.

Another important trend has been the role of boom style firms, something we’ve previously written about. Researchers hypothesize a significant difference in the profitability arc for these ‘boom’ firms, which engage in protracted periods of muted or negative profitability before inflecting meaningfully. The classic example being a biotech firm that will have no revenue whatsoever for years, prior to a breakthrough drug which reaps extended profitability, protected by patent. This type of firm has extended its reach throughout the economy and investors have demonstrated a willingness to pay for that non-linear profit curve, skewing the aggregate multiple of an index. Whether or not it is justified, remains to be seen.
Finally, the increasing role of intangibles, increasing returns and network effects in creating equity value leads to problems with traditional valuation metrics, perhaps the most afflicted being price/book. The point being: there are important differences in the composition of today’s economy versus the days of industrialization.
All this goes to say that establishing base rates and applying them to investing is important for improving the quality of prediction, but those base rates need to be examined from the ground-up, rather than being axiomatically applied based upon a chart. Non-Stationarity is very difficult for simple pattern recognition to detect because our brains are wired to find treasure where there is only pyrite. While mean reversion may be the most powerful overarching force in investing, its application should be done with caution.
---
The information contained in this article was obtained from various sources that Epsilon Asset Management, LLC (“Epsilon”) believes to be reliable, but Epsilon does not guarantee its accuracy or completeness. The information and opinions contained on this site are subject to change without notice.
Neither the information nor any opinion contained on this site constitutes an offer, or a solicitation of an offer, to buy or sell any securities or other financial instruments, including any securities mentioned in any report available on this site.
The information contained on this site has been prepared and circulated for general information only and is not intended to and does not provide a recommendation with respect to any security. The information on this site does not take into account the financial position or particular needs or investment objectives of any individual or entity. Investors must make their own determinations of the appropriateness of an investment strategy and an investment in any particular securities based upon the legal, tax and accounting considerations applicable to such investors and their own investment objectives. Investors are cautioned that statements regarding future prospects may not be realized and that past performance is not necessarily indicative of future performance.