

Crisis of Replicability – “The Gold Rush in Quant Finance” (Part II)
the problem is not merely with claims that are ridiculous on scientific grounds, but more broadly that many statistically significant claims will be in error. – Andrew Gelman
In the first part of this series, we wrote about the broader issues of research replicability touching all fields of scientific research. Research initiatives in quantitative finance are no different. If anything, replicability problems may be more acute given the ease and loose oversight of turning findings into commercial products. To give you a taste, research by Antti Suhonen, Matthias Lennkh, and Fabrice Perez found an 8% replicability rate for backtest vs live-money Sharpe Ratios across a sampling of 200+ smart beta investment products. This is a staggeringly poor result. Why are we seeing such problems in replicability when it comes to quantitative investment strategies?
Gold Standards and Opportunity Costs
Like public-health studies, quantitative investment studies suffer from a deficiency in control. When a researcher attempts to tackle whether or not alcohol consumption is unhealthy, they cannot do so via a randomized control trial (“RCT”), which is the gold standard of scientific research. To do so would require tasking a significant population throughout their lives to drink placebo alcohol. Strictly speaking, this is impossible to control. As a result, complex statistical methods are used to tease out causality and highly complex relationships, in an indirect fashion. These studies are often contentious and contradicted.
In quantitative finance, we have a similar issue, in that we can’t run a controlled experiment, per se. There is one environment, which is the live market. At best, we can forward test our hypotheses, best with live money. Unfortunately, this process is attenuated. Take this study of longitudinal factor efficacy by Gene Fama and Ken French (we wrote about it here). They find that the inherent nature (and unpredictability) of market volatility means that efficacy of an investment signal can only come apparent after a very long time.
To rigorously forward-test a strategy, it may take years or even decades for results to become statistically significant. This is a huge opportunity cost, and it puts a huge strain on the financial incentive for conducting expensive research. As a result, researchers (both academic and practitioners) choose to examine anomalies through backtest.
Backtesting is a huge luxury in our field. Financial data is structured, well cataloged, and thus readily applicable for historical study. For many (not all) anomalies studied, the impact of actual measurement (i.e., implementation) is negligible, so plausible inference can be made through historical tests. Standards have been written about reasonable trading-costs and liquidity adjustments. It seems like a magic solution.
Unfortunately, backtesting is both a luxury and a problem. Conducting experiments are so trivially easy with today’s flexible computing power and suite of high-caliber market data vendors. Nowadays, every quantitative researcher has access to well defined historical data: on the academic side, WRDS is a great tool for standardized information that allows for controlled experimentation. It includes security pricing (e.g., CRSP), security fundamentals (e.g., COMPUSTAT), and even factor data. For commercial practitioners, data vendors provide a plethora of added data. They are financially incentivized for tackling the thorniest of data munging problems and know how to serve this data to their customers in a way to reduce the friction of extraction, transformation, and loading (ETL), allowing them to focus on analysis and synthesis.
Compare this to a therapeutic trial, where to begin, animal tests have to be conducted in a physical controlled lab, analyzed, dissected, and aggregated in order to proceed to a secondary phase. Then patients need to be recruited, incented, controlled, and tested. The very examination process can cost billions of dollars. We have it good!
Eureka?
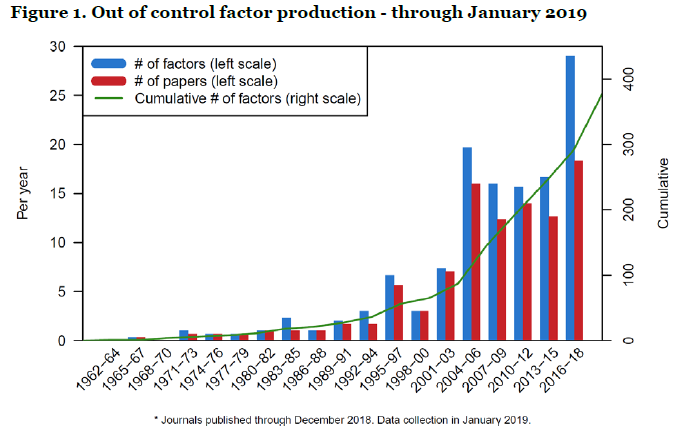
The discipline of a structured RCT trial has its virtues. It ensures that researchers do not Skip Jail before Passing Go and collecting their gold (hint: significant results). Significant results are the holy grail in quant finance. Publishing them can lead to Nobel prizes for researchers, not to mention fame and recognition. Unsurprisingly, there has been an explosion of research in the factor space purporting to find the newest path to excess performance. The following chart by Professors Campbell Harvey and Yan Liu – who have been at the vanguard of addressing these issues in quant finance – helps illustrate:

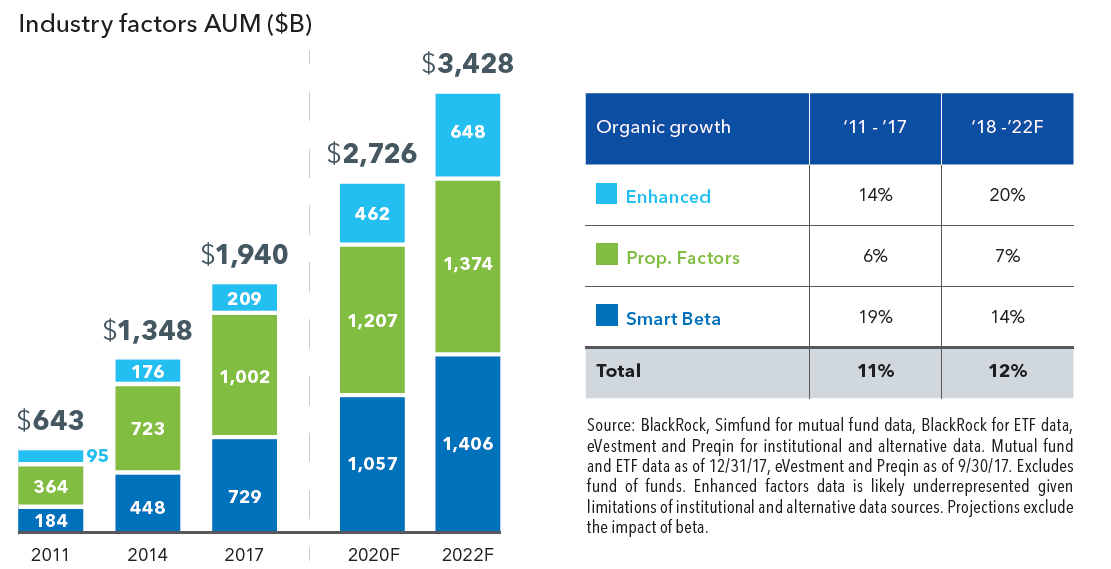
Findings also drive significant commercial opportunity, having fueled the rise of multi-billion dollar businesses. According to a report by BlackRock (no stranger to these waters), investment products built upon quantitative research (“smart beta”) have nearly $2trn in assets invested as of the end of 2017 (see Blackrock chart below). In a survey conducted in 2018, FTSE Russell found that 77% of asset owners they polled (representing $2trn of AUM) are either evaluating or have implemented these products.

On the lookout for Fool’s Gold
So what do we need to be on the lookout for, and what are the proposed solutions to this issue? Reverting back to Professor Ioannidis’ prescriptive detailed in Part I, we highlight some of the key problems of replicability and frame them specifically with the backdrop of quant finance:
- Bias
- Multiplicity of Testing
- Study Design
Bias
At the surface, this is an easy one, in part because the financial and reputational interests are obvious. Beyond outright manipulation, bias creeps into the scientific process in nefarious and often hidden ways. Take aberrant market conditions such as the financial crisis of 2008. With complex trading strategies, aberrant market conditions may override rules that govern risk-taking. The default may innocuously be to reduce exposure in such circumstances. A backtest with these conditions will demonstrate miraculous performance in such periods because it presciently de-risked into such an environment. This is a classic overfitting exercise that biases the results of a backtest. To remove the bias requires one to override a ruleset that inadvertently amps one’s Sharpe ratio dramatically. We call this the “stop-loss phenomenon”, where market participants witness a painful market correction, then assume had they implemented an arbitrary stop-loss that such situations could be averted. We fool ourselves into thinking that this isn’t pure hindsight bias. More importantly, what’s the incentive to fix it?
Multiplicity of Testing
Statistical inference often boils down to balancing Type I and Type II errors. This has led to a standard of significant p-values or t-stats (statistical measurements) that have codified around a .05 and 2 threshold, respectively. In lay terms, there is a tolerance for false-positives at a 5% confidence level. On any single test, that’s a relatively high hurdle. But throw enough tests out there and you will find spurious significance.
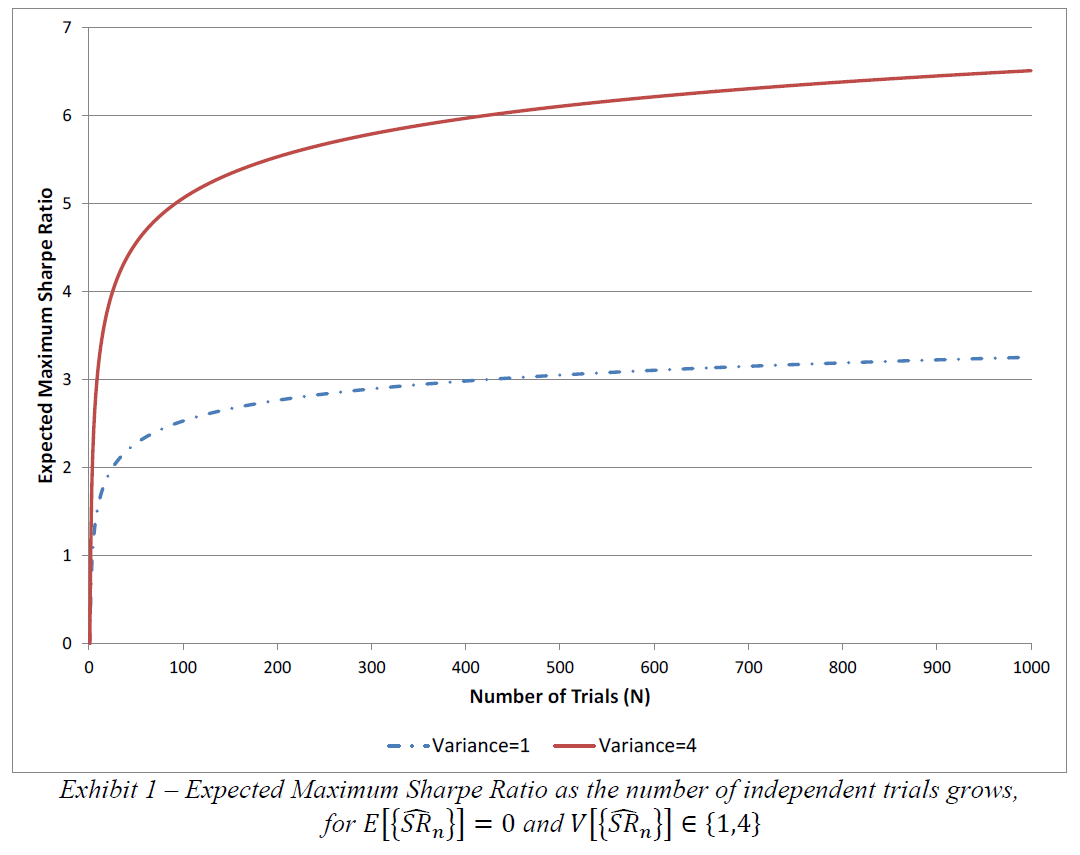
It’s very easy in a backtest to run dozens, hundreds, or thousands of combinations/permutations to find results that sing. Undoubtedly what is reported glosses over this fact, and thus conflates statistical significance with a multiplicity bias. Or as Marcos Lopez de Prado and Professor Michael J. Lewis put it, “The practice of carrying out multiple tests without adjusting the rejection threshold is so widespread and misleading that the American Statistical Association considers it unethical (American Statistical Association [2016]).” This means that results that demonstrate significance may need higher bars for acceptance. The following chart by Professor David Bailey and Marcos Lopez de Prado gives a sense of the difference in significance (or efficacy) that must be met if there are multiple trials preceding the reported results:

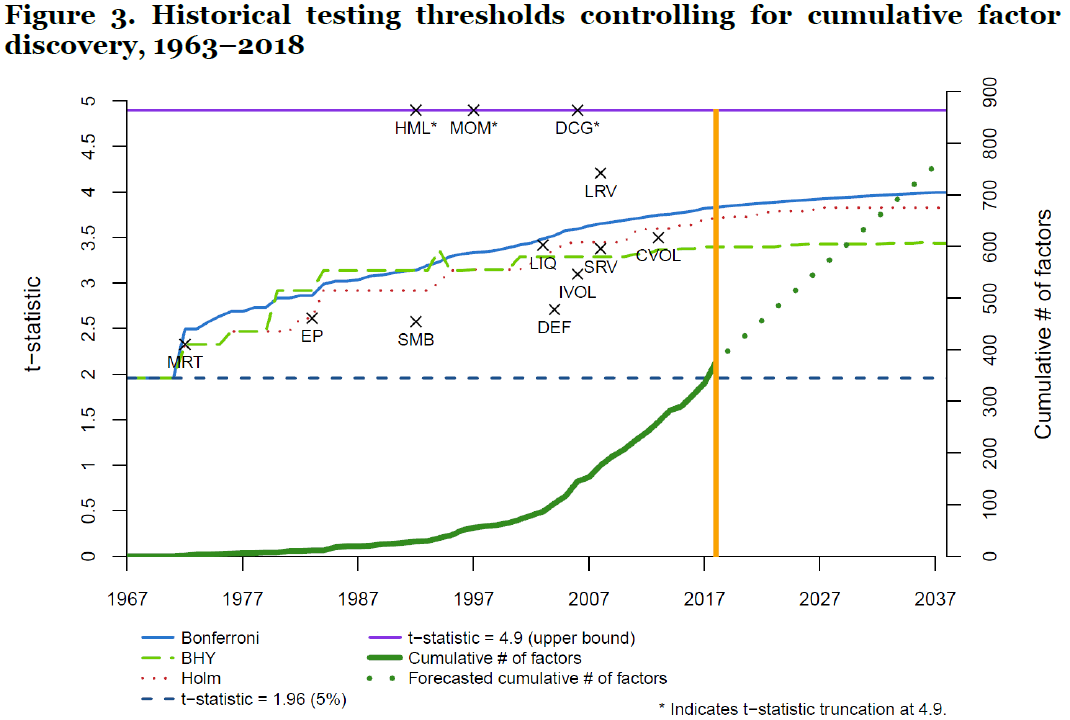
A particularly pernicious form of this bias is highlighted by Professors Harvey and Liu. They claim not only that individual researchers engage in multiplicity of testing when reporting results, but that the canon of literature highlighting known factors means that there is historical multiplicity in the aggregate findings across all research. The antidote? A higher bar for statistical significance in a nonlinear fashion. The following chart helps show how the bar should be raised over time (x marks well-known factor discoveries and their associated historical t-stats):

Study Design
As the low hanging fruit continues to be plucked, quantitative researchers continue to reach for ever-complex factors with more intricate calibrations in order to unearth increasingly sparse market anomalies. 35 years ago, it was deemed profitable just to buy small companies versus big, sorted on market cap. Nowadays, to define a new factor, we see dozens of signals tuned and harmonized to pitch-perfection. This has led some to question the veracity of this approach. To get a sense for why, the following presentation by Professor Novy-Marx touches on the pitfalls of multiple-signal combination. While a bit wonky, it is a master-class into the problem.
At a more basic level, studies are very selective about the time-range of data, the presentation, sanitizing outliers, and the methodologies chosen to represent output. All of this goes into study design, and it is very hard for lay people to capture simply by reading an abstract. You have to read dozens if not hundreds of papers to begin to spot interesting design choices, and even then, without replicating the whole thing yourself, you’ll never know the intricacy / nuance behind a choice which may be simply benign or latently biased.
Research journals are coming around to this problem, often requiring researchers to prespecify their endpoints, so results cannot be overfit after the fact. The spearpoint of this effort has been in medical clinical trials where goosing endpoints have multi-billion dollar impacts.
Getting Fool’s Gold out of the System
While it would take a full paper to rehash the solutions to these issues, I leave you with some quotes on solutions:
…it is crucial to impose a higher hurdle for declaring a factor significant. Two sigma is far too weak a threshold and leads to an unacceptably large number of false positives. – Harvey & Liu, 2019
As soon as a researcher conducts more than one backtest on a given dataset, backtest overfitting is taking place with a non-null probability. For this reason, every firm, investor, regulator and academic journal should cease to accept backtests unless the researcher reports the probability of backtest overfitting (Bailey et al. [2017]) – de Prado & Lewis, 2018
…many multiple testing corrections are suggested in the literature. The simplest is the Bonferroni correction…The Bonferroni correction simply multiplies the p-value by the number of tests. Harvey & Liu, 2019
The Deflated Sharpe Ratio (DSR) corrects for two leading sources of performance inflation: Selection bias under multiple testing and non-Normally distributed returns. In doing so, DSR helps separate legitimate empirical findings from statistical flukes – Bailey & de Prado, 2014
I think it would be good for statistical practice to move forward from the paradigm of yes/no decisions drawn from stand-alone experiments – Andrew Gelman, 2013
—
Bailey, David H. and Borwein, Jonathan and López de Prado, Marcos and Zhu, Qiji Jim, Pseudo-Mathematics and Financial Charlatanism: The Effects of Backtest Overfitting on Out-of-Sample Performance (April 1, 2014).
Bailey, David H. and Borwein, Jonathan and López de Prado, Marcos and Zhu, Qiji Jim, The Probability of Backtest Overfitting (February 27, 2015). Journal of Computational Finance (Risk Journals), 2015, Forthcoming.
Bailey, David H. and López de Prado, Marcos, The Deflated Sharpe Ratio: Correcting for Selection Bias, Backtest Overfitting and Non-Normality (July 31, 2014). Journal of Portfolio Management, 40 (5), pp. 94-107. 2014 (40th Anniversary Special Issue).
López de Prado, Marcos and Lewis, Michael J., Detection of False Investment Strategies Using Unsupervised Learning Methods (August 18, 2018).
Fama E, French K. Volatility Lessons. Financial Analyst Journal, Vol. 74, Issue 3. 2017
Suhonen, Antti and Lennkh, Matthias and Perez, Fabrice, Quantifying Backtest Overfitting in Alternative Beta Strategies (May 6, 2016). Journal of Portfolio Management Vol. 43, Nr. 2 (Winter 2017)
—
The information contained on this site was obtained from various sources that Epsilon believes to be reliable, but Epsilon does not guarantee its accuracy or completeness. The information and opinions contained on this site are subject to change without notice.
Neither the information nor any opinion contained on this site constitutes an offer, or a solicitation of an offer, to buy or sell any securities or other financial instruments, including any securities mentioned in any report available on this site.
The information contained on this site has been prepared and circulated for general information only and is not intended to and does not provide a recommendation with respect to any security. The information on this site does not take into account the financial position or particular needs or investment objectives of any individual or entity. Investors must make their own determinations of the appropriateness of an investment strategy and an investment in any particular securities based upon the legal, tax and accounting considerations applicable to such investors and their own investment objectives. Investors are cautioned that statements regarding future prospects may not be realized and that past performance is not necessarily indicative of future performance.